
Why this matters
The most common question our support desk gets about reporting is whether SimpleRisk can build custom reports. It can. The Dynamic Risk Report is a report builder: you decide which risks it covers, how they're grouped and sorted, which columns appear and in what order, and then you save that arrangement under a name and pull it back up in one click.
This is where the "monthly board pack" and the "everything my team owns" views come from. Building them once and saving them beats rebuilding the same filter stack every month, and it means the number your CISO sees in March was produced the same way as the number they saw in February. A saved report can be private to you or shared with everyone who has Risk Management access, and each one has its own link you can bookmark or paste into a meeting agenda.
A report doesn't have to be a table. The same arrangement can be drawn as a bar, donut or line chart, or as a row of KPI tiles, and a saved report can be pinned to a dashboard so the chart is waiting for you when you sign in.
The page updates in place. Changing the status, the grouping, a sort, a filter or a column re-runs the report without reloading the page, so you can try an arrangement, look at it, and change your mind cheaply.
Before you start
- Access to Risk Management. The report needs the
Allow Access to "Risk Management" Menupermission. Without it the report doesn't appear in the Reports hub. - The
Able to Add Saved Risk Reportspermission to save a report or duplicate one. Without it you can still build and read any report you can open, but there's no Save button and no Duplicate action. - The
Able to Delete Saved Risk Reportspermission to delete one. You also have to be the report's owner or an administrator. - The Import-Export Extra, if you want to export the report to a spreadsheet. Without it there's no Export button.
- The Customization Extra, if you want to pin a report to a dashboard. Without it the Pin to dashboard control is shown but locked (see step 11).
Everything the report shows is still limited by your own access. If your instance separates risks by team, a shared report shows each person only the risks they could see anywhere else in SimpleRisk.
Step-by-step
1. Open the report
Sidebar: Reporting → Reports opens the Reports hub. From there pick Dynamic Risk Report (/reports/dynamic_risk_report.php).
A fresh report opens titled Unsaved report, covering open risks, ungrouped, sorted by inherent risk with the highest first, and showing your default columns.
2. Choose the status, grouping and sort
The toolbar across the top of the table holds the controls you'll use most:
- Open, Closed and All — which risks the report covers.
- Group By — None, or one of Category, Control Regulation, Month Submitted, Next Step, Owner, Owner's Manager, Project, Risk Level, Risk Scoring Method, Risk Source, Status, Team or Technology.
A grouped report draws a band above each group with the number of risks in it and their average inherent and residual risk. Click a band to collapse or expand it. Risks with no value for the grouping field land in an Unassigned group. A risk that belongs to several teams (or technologies) appears under each of them, so grouping by Team or Technology can list the same risk more than once. If the report also filters on that same field, only the groups you filtered to are shown: filter on Team Finance and group by Team, and a risk shared by Finance and Legal appears under Finance only. The footer then counts the rows shown and, next to the number of groups, how many distinct risks they cover; each band counts only the risks in that group.
Below the table, Rows per page sets how many rows show at once: 25, 50, 100, 250 or Show all. Show all loads the rows in batches and shows a progress line while it works. It stops at 5,000 rows; if your report has more, a notice reads "Showing the first 5,000 of {total} rows. Narrow the report or export it to see the rest." Narrow the filters, or export the report if you have the Import-Export Extra. Your choice is remembered in this browser; it isn't saved with the report or put in its link.
To sort, click a column header. The first click sorts ascending, the second descending, and the third returns to the default order (inherent risk, highest first). The footer says when the default order is in use. You can also tab to a header and press Enter.
3. Choose a view
The Table, Bar, Donut, Line and KPI buttons next to the toolbar switch how the report is drawn. Table is the default and is what the rest of this article describes. The other four turn the same status, filters and grouping into a picture; the Columns button is replaced by Chart options, since a chart doesn't use columns.
- Bar draws one horizontal bar per group, split into segments by risk level in the colors your instance uses for each level. With no grouping it draws a single bar for all risks.
- Donut draws one slice per group. With no grouping the slices are the risk levels.
- Line draws what happened over time, one point for each period, filling in periods with nothing so the line doesn't skip. Which lines appear is up to you through the Series list in Chart options; until you change it, the status chips decide: Open shows opened risks only, Closed shows closed ones only, and All shows both. With a grouping chosen, the line view splits one series by group instead (see below).
- KPI shows tiles instead of a chart: the total number of risks, the average inherent risk and the average residual risk. With a grouping you get one tile per group.
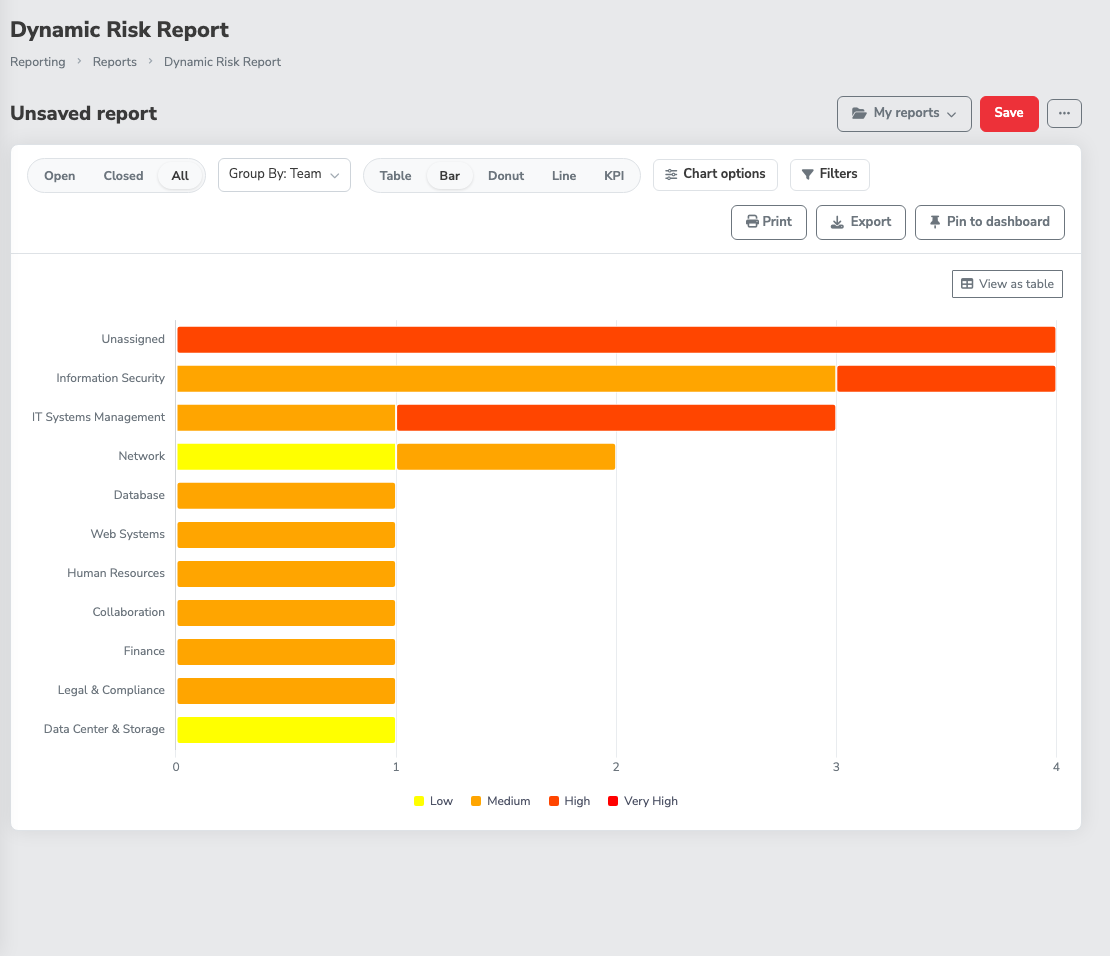
Chart options holds the settings that apply to the view you're on:
- Title puts a heading above the chart (all four chart views).
- Color by chooses whether a bar's segments follow Inherent Risk or Residual Risk (Bar only).
- Time period sets the size of each point on the line: Day, Week, Month, Quarter or Year (Line only). The default is Month. When the date range is long, a fine period would need thousands of points, so the chart steps up to the next larger period on its own and says so under the chart, for example that it's shown by week because the date range is too long for day.
- Series chooses which lines the Line view draws, from one to eight. Each checkbox has a one-line hint under it saying what it counts and by which date: Opened (risks submitted in each period), Closed (risks closed in each period, by closure date), Backlog (risks still open at the end of each period), Mitigation Planned (mitigations entered in each period, by the date the mitigation was submitted), Mitigation Due (mitigations due in each period, by their planned-by date), Reviewed (risks last reviewed in each period), Score (the average, minimum, maximum or total score of the risks submitted in each period, for inherent or residual risk, chosen with Score of and Aggregate) and Days to close (the average number of days it took to close the risks closed in each period). Every line covers the same stretch of time, so a line with nothing to count, such as Closed on a report of open risks, is drawn as a flat line at zero rather than leaving the chart empty. A period with no scored risk, or no closed risk for Days to close, is never drawn as zero: the line connects across it with a dashed stretch, and the periods that do have data keep their points. Mitigation Due can run past today, since planned-by dates are often in the future; the time axis stretches to the last due date (up to a year ahead), and the other lines show zero or a gap there. Counts, scores and days are measured on their own axes, so they can share one chart. Pick a Style of line, area or bar; areas and bars stack when the parts add up to a whole. The last checked series can't be unchecked, and the checkbox says so.
- Running total makes the counts (Opened, Closed, Mitigation Planned, Mitigation Due and Reviewed) show the total to date instead of restarting each period. For Score it shows the aggregate you chose over every risk to date: the average, minimum or maximum so far, or, for the total, the sum so far. Backlog and Days to close don't change.
- Group by in the toolbar splits the Line view: the first series you ticked is drawn once for each group (a team, say) with the same limit on the number of groups as the donut, the rest combined as Other.
- X axis label and Y axis label replace the default axis titles (Line only).
- Show top and Combine the rest as Other keep a crowded chart readable (Bar and Donut). Only the largest groups get their own bar or slice, 12 by default and up to 50, and the rest are added together into one Other entry. Untick the box to drop the rest instead. A donut has a tighter limit of its own: it never draws more than seven slices plus Other (eight slices if you drop the rest), whatever you enter in Show top. The KPI view applies the same limit to its tiles and adds a line such as "9 more groups not shown".
Risks that haven't been scored yet appear as Unscored, in a neutral color, so a bar or slice always adds up to the group's real count rather than quietly dropping them.
Every chart has a legend with the numbers, and the View as table button switches back to the rows behind it. A chart for a report with no matching risks says No Data Available and offers Clear filters. Switching view doesn't change which risks are in the report, and the view is saved with the report: the Save dialog's summary ends with, for example, "Bar view", and the library shows each report's view.
4. Filter the risks
Click Filters, then pick a column under Filter on. What you get depends on the column:
- A list of values for fields like Team, Category, Owner or Risk Source. Tick as many as you need; Unassigned matches risks with no value. Next to each value a small number shows how many risks it would keep, given the status and your other filters (not this column's own, so picking a value never hides the others). A risk on several teams counts under each of them, so the numbers can add up to more than the report's total. A value that would keep nothing is dimmed but can still be ticked, and if the numbers can't be loaded the plain list still works. A search box narrows long lists. Affected Assets lists your assets and, under their own Asset Groups heading, your asset groups. Ticking a group matches risks linked to the group itself and risks linked to any asset in it.
- Risk Level and Residual Risk Level, a list of the risk levels your organization has configured (for example Low, Medium, High and Very High). Tick one or more to keep the risks whose inherent or residual score falls in those levels. A level that isn't configured isn't offered, and Unassigned matches risks with no score. These two are filters only: they aren't columns you can show.
- Contains for text and date fields. The report matches any part of the value, so a project code typed into Subject finds every risk that mentions it.
- A comparison for number fields such as the risk scores and Days Open. Choose Greater than, Greater than or equal to, Equals, Less than or equal to or Less than, then type the number. The chip reads naturally, for example "Inherent Risk is greater than 7".
Each column takes one filter. Every filter you set shows as a chip under the toolbar, and the Filters button counts them. Click a chip to change it, click its X to remove it, or use Clear filters to remove them all. On a narrow screen, the chips move inside the Filters panel.
When nothing matches, the report says No risks match your filters and offers Clear filters right there.
5. Choose and order your columns
Click Columns. The left side lists every column you can show, grouped under Risk, Mitigation, Review, Risk Scoring and Risk Mapping, plus Custom Fields when the Customization Extra is active. Tick a column to show it and untick it to hide it; the search box at the top finds a column by name.
For CVSS-scored risks, the Risk Scoring list has a Vector column that shows the whole vector string, and one column for each CVSS metric, labeled with the metric and its short code, such as CVSS: Access Vector (AV) or CVSS: Privileges Required (PR). A metric column fills in for every risk whose version defines that metric, whichever CVSS version scored it, and stays empty for risks scored another way. Metrics that share a code share a column, so CVSS: Confidentiality Impact (C) reads None, Partial or Complete for a v2.0 risk and None, Low or High for a v3.x one. A metric with its own code, such as VC in v4.0, is its own column. You can sort and filter on the metric columns. A filter matches the text a cell shows, so "Adjacent" and "Adjacent Network" are different filters. The Vector column is there to read and to export, so it has no filter and doesn't sort.
The right side, Shown, is the order the columns appear in the table. Drag a column by its handle to move it, or focus the handle and use the up and down arrow keys. Reset to default puts back your default columns. A report needs at least one column, so the last one can't be removed.
That custom-fields list is what most "custom report" requests are actually reaching for. The field usually isn't missing; it just needs adding to the column set.
6. Save it
Click Save. The Save report dialog asks for two things:
- Name, up to 100 characters.
- Who can open it: Private (only you, and administrators) or Public (everyone with Risk Management access can open and duplicate it, and only you or an administrator can change it). Private is the default.
Under Saved with this report the dialog summarizes exactly what's being saved: the status, how many filters, the grouping, the sort, and the columns in their order.
Names have to be unique among your own private reports and among every public report on the instance. If someone else already published a public report called "Q3 Board Pack," you'll need a different name.
Once saved, the title bar shows the report's name and a Private or Public label, and the address bar carries the report's link, dynamic_risk_report.php?selection={id}.
7. Keep a saved report up to date
Change anything on a saved report you own and a Modified label appears next to its name. Click Save to write the changes over the report, or Save as… to keep the original and save the changes as a new report.
If you open someone else's public report and change it, Save opens the Save report dialog instead and makes a new report of your own; the original isn't touched. Switching to another report while you have unsaved changes asks before throwing them away.
The More actions menu (the ⋯ button in the title bar) holds the rest:
- Duplicate copies the report into a new private report of yours, named after the original with "(copy)" on the end.
- Edit name and visibility renames the report or switches it between Private and Public. Only the owner or an administrator sees it.
- Delete report removes the report for everyone who could open it, after a confirmation. The risks themselves aren't changed.
- New report starts a fresh, unsaved report.
- Open library opens the report library.
8. Reopen and share it
There are three ways back to a saved report:
- The report switcher. The My reports button in the title bar lists your own reports, then the shared ones under Shared.
- The report library. Choose Open library from the switcher or the More actions menu. Report library lists every saved report you can open with its Owner, its Visibility and its view. The My reports, Shared and All chips narrow the list, and each row offers Open, Duplicate, Edit name and visibility and Delete when you're allowed to use them. Back to report returns to the report you were on.
- Its link. The
?selection={id}address is stable. It's the link to share when you want the saved report itself, and it keeps working after you edit and re-save the report. Bookmark it, put it in a recurring calendar invite, or drop it in the channel where your team does its weekly review.
A Private report's link only works for its owner and for administrators. Anyone else who follows it gets the default report, with a note that the saved report doesn't exist or they don't have access to it. Administrators see everyone's private reports in the library too.
Share what you're looking at
You don't have to save a report to share it. A fresh report keeps the plain address until you change something. From your first change on (the status, grouping, sort, filters, columns, view or a chart option, or opening a saved report), the address bar follows the report as you work, so copying it sends a colleague to the same view. If you haven't touched anything, there's nothing to share yet. Opening it restores the filters, grouping and columns exactly, whatever default columns the recipient has set for themselves, and the Back and Forward buttons step through the reports you opened, started a new report from, or reset the columns on. If you changed a saved report without saving it, the link opens that saved report with your changes applied and marked Modified; whether the recipient can save over it still depends on who owns it, and otherwise they can use Save as… for their own copy. The link carries the report's settings, never access: a private report you can't open still shows the "doesn't exist or you don't have access" note. Rows per page and the page you're on aren't part of the link, and neither is anything you haven't changed from the defaults. A link whose settings can't be read opens the default report with a note saying so.
9. Export what's on screen
With the Import-Export Extra active, the toolbar has an Export button. It downloads the report as an Excel spreadsheet named Dynamic Risk Report - {date and time}.xlsx, with the same risks, the same columns in the same order, and the same grouping as the screen. A grouped report also has a download icon on each group band (Export the {group} group) that exports just that group.
If the export says To export a grouped report, update the Import-Export Extra., the Extra installed on your instance predates grouped exports. Ungrouped exports still work; ask your administrator to update the Extra. For other export paths, see Exporting Data and Evidence.
10. Print the report
Click Print in the toolbar. The report opens in a new tab laid out for paper, with none of the page's menus or buttons, and the browser's print dialog opens on its own. Choose a printer, or choose Save as PDF as the destination to get a file.
The top of the printout carries the report's name, the date and time it was run, who ran it, the number of risks, the status, the grouping, the visibility and the filters written out in words, so a page pulled out of a binder still says what it covers. A table prints with its header repeating on every page, group bands intact and risk-level colors kept. A chart view prints the chart with its legend and a table of the same numbers beneath it.
- Wide reports print landscape. A table with more than eight columns prints on a landscape page; narrower ones and the chart views print portrait. A very wide report is scaled down to fit the page, so it's complete but small.
- Page numbers. The footer carries the report name, "Page X of Y" and the run date. The page numbers appear when you print from Chrome, Edge or another Chromium-based browser; other browsers print the report without them.
- 5,000 rows at most. A long report prints its first 5,000 rows and says so at the top. Narrow the filters to print the rest.
The printout shows the same risks the screen does, limited by your own access. If the report is unsaved and its settings are too long to carry in a link, the print tab asks you to save the report first and print the saved one. A saved report that is private to someone else, or that has been deleted, prints a note that it doesn't exist or you don't have access to it.
11. Pin it to a dashboard
A saved report can sit on the Home or Risk Management Dashboard as a widget, drawn as a bar, donut, line or KPI chart. The widget always shows the report's current data, so nothing is out of date, and each viewer still sees only the risks their own access allows.
You can start from either end. From the dashboard, Edit layout, Add widget and then the report's own entry under Saved reports opens a dialog where you choose its view, size and title (see Customizing a Dashboard Layout). From the report itself, use Pin to dashboard, described here. Both need the Customization Extra and the permission to save reports, and both produce the same widget. To take the widget off again, use Edit layout (it needs the Customization Extra), click the ✕ on its tile and then Save; the saved report itself is never deleted.
Pin to dashboard is in the toolbar next to Print. Before it works, three things have to be true:
- The Customization Extra is active. Without it the control is shown with a Locked badge and can't be clicked, and one line beside it says why. For an administrator it depends on where the Extra stands: if it hasn't been added to the instance, the line reads "Requires the Customization Extra." with a See what it adds link; if it's installed but switched off, the line reads "The Customization Extra is installed but not turned on." with a Turn it on link. Anyone who isn't an administrator sees only "An administrator can set this up.", with no link.
- The report is saved and unchanged. An unsaved report gets a note saying to save it first. A saved report with edits (the Modified label is showing) says to save your changes first, because a widget shows the saved report and not what's on your screen.
- You can save reports. Pinning needs both Risk Management access and the
Able to Add Saved Risk Reportspermission. Without them the panel says you need permission to save reports.
With those in place, Pin to dashboard opens a panel with these fields:
- Title, up to 120 characters. Leave it blank and the widget uses the report's name, and follows it if you rename the report.
- Dashboard: Home or Risk Management Dashboard. Only the dashboards you have access to are listed.
- View as: Bar, Donut, Line or KPI. It starts on the view you're looking at, or Bar if you're on the table.
- Size: Small, Medium or Large. Medium is the default, because a small tile only has room for a couple of bars.
Click Pin. A message confirms it, with an Open dashboard link, and the widget lands in the first free spot on that dashboard. Move or resize it from Edit layout like any other widget (see Customizing a Dashboard Layout).
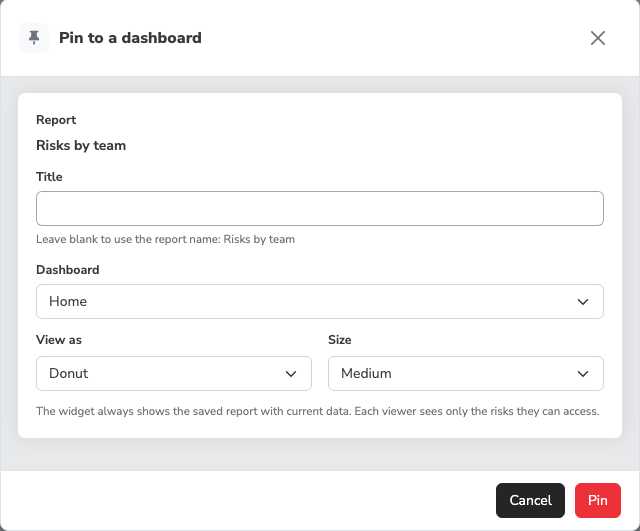
A few things to know once a report is pinned:
- The widget follows the report. Edit and re-save the report and the widget changes with it. The pinned view and size are the widget's own, so changing the report's view doesn't change the widget.
- It can become unavailable. If the report is deleted, made private by its owner, or you can no longer see it, the widget turns into a Report unavailable tile that says "This report was deleted, made private, or you no longer have access to it." It never shows data in that state. Remove the tile, or restore access.
- On my dashboards. The report library has an On my dashboards column counting the widgets of yours that use each report. Deleting a pinned report warns you first that "1 of your dashboard widgets uses this report" and that it will show as unavailable. The count covers your own dashboards, not other people's.
- Pinning for everyone. If you're an administrator and your layout for a dashboard is saved as the organization's default, a widget you pin there appears for everyone who hasn't customized that dashboard. The panel warns about this when you pick that dashboard, and only a Public report can be pinned there, since a private report would show everyone else an unavailable tile. Make the report public or pick another dashboard.
Older links and saved reports
Links to the report from before this design keep working. The Home dashboard's tiles and older bookmarks that set the status, grouping and sort in the address open an unsaved report with those settings, so a team-grouped link still opens grouped by team.
Reports saved before the redesign carry over with their columns, column order, status, grouping, sort and filters, under the same name and visibility. That includes greater-than and less-than filters on number columns ("Inherent Risk greater than 7" opens as a Greater than comparison on 7) and asset group filters on Affected Assets (they open as ticked groups under Asset Groups). Only a filter that can't be read at all is left out, such as a number filter whose value isn't a number.
Selections saved on the retired Graphical Risk Analysis page were copied into saved reports as well, each opening in the Line view. The chart type, status, time period, score measure (inherent or residual) and axis labels carry over, and so do the risk levels you had ticked, which come across as a Risk Level filter. A selection that used the old "Count Total" opens as a running count of risks: the line climbs as risks are opened. A selection saved for all risks opens with the single line it had, not an extra Closed line. Two things look different from the old page. A Count chart now shows 0 for a period with no new risks, where the old page carried the previous period's value forward, so it reads as spikes rather than steps. Average, Min and Max now connect across a period with no scored risks with a dashed stretch, where the old page drew 0. If you had ticked only the lowest, "Insignificant" level and no configured level matches it, the report keeps every level rather than showing an empty chart. The name and visibility stay the same; if you or a public report already had that name, the copy is called "{name} (Graphical)" instead. A selection that couldn't be read at all wasn't copied.
Check an older saved report the first time you open it, and save it again once its filters are right. If a column the report used is no longer available (a custom field was deleted, or an Extra was deactivated), the report opens without it and a note at the top names what was removed.
Common pitfalls
-
Treating Public as team-scoped. It isn't. A public saved report can be opened by every user who has Risk Management access. If a view is only meaningful to one department, or its name gives away something you'd rather not broadcast, save it Private and share the configuration some other way.
-
Expecting a public report to share its data. It shares the configuration, not the rows. Each person who opens it sees only the risks their own access allows, so two people can open the same public report and get different counts. That's by design: a shared report never widens anyone's access.
-
Assuming the saved report captures the data. Reopening a saved report next quarter runs it against the register as it stands then, not as it stood when you saved it. That's usually what you want for a recurring view; it's the wrong tool for "the exact numbers I showed the board in March." For a point-in-time record, export the report (step 9) and file the spreadsheet.
-
Forgetting to save after a change. The Modified label is the only reminder. Close the tab with it showing and the change is gone; the saved report stays as it was.
-
Trusting a migrated report's numbers without a look. Older saved reports carry their filters over, but a filter that couldn't be read is left out and the report then shows more risks than it used to. Open your older saved reports once and check their filters before the next time someone reads the output.
-
Expecting a pinned widget to show your unsaved changes. It shows the saved report. If the widget looks different from your screen, save the report and the widget catches up.
-
Reading a stacked bar as the group's total. Each bar is split into one segment per risk level, plus Unscored for risks with no score. If a bar looks shorter than the group's count, check the legend for an Unscored segment.
-
Printing from a browser that drops the page numbers. The footer's "Page X of Y" appears only in Chromium-based browsers. If you need numbered pages, print from Chrome or Edge.
-
Looking for the Graphical Risk Analysis page. It's retired. Its charts are the Dynamic Risk Report's Line view, and an old bookmark to the page now lands on the Dynamic Risk Report. Selections you saved there are among your saved reports (see Older links and saved reports).
-
Reaching for a saved report when a built-in one already exists. Thirty-odd reports ship with SimpleRisk. Walk The Built-In Reports before you build and name something that duplicates one of them.